Scenario: Classic RCT
We call 'Classic Randomized Controlled Trial' (RCT) a scenario where a treatment is randomly assigned to participants, and we do not have pre-experiment data of participants like pre-treatment outcome.
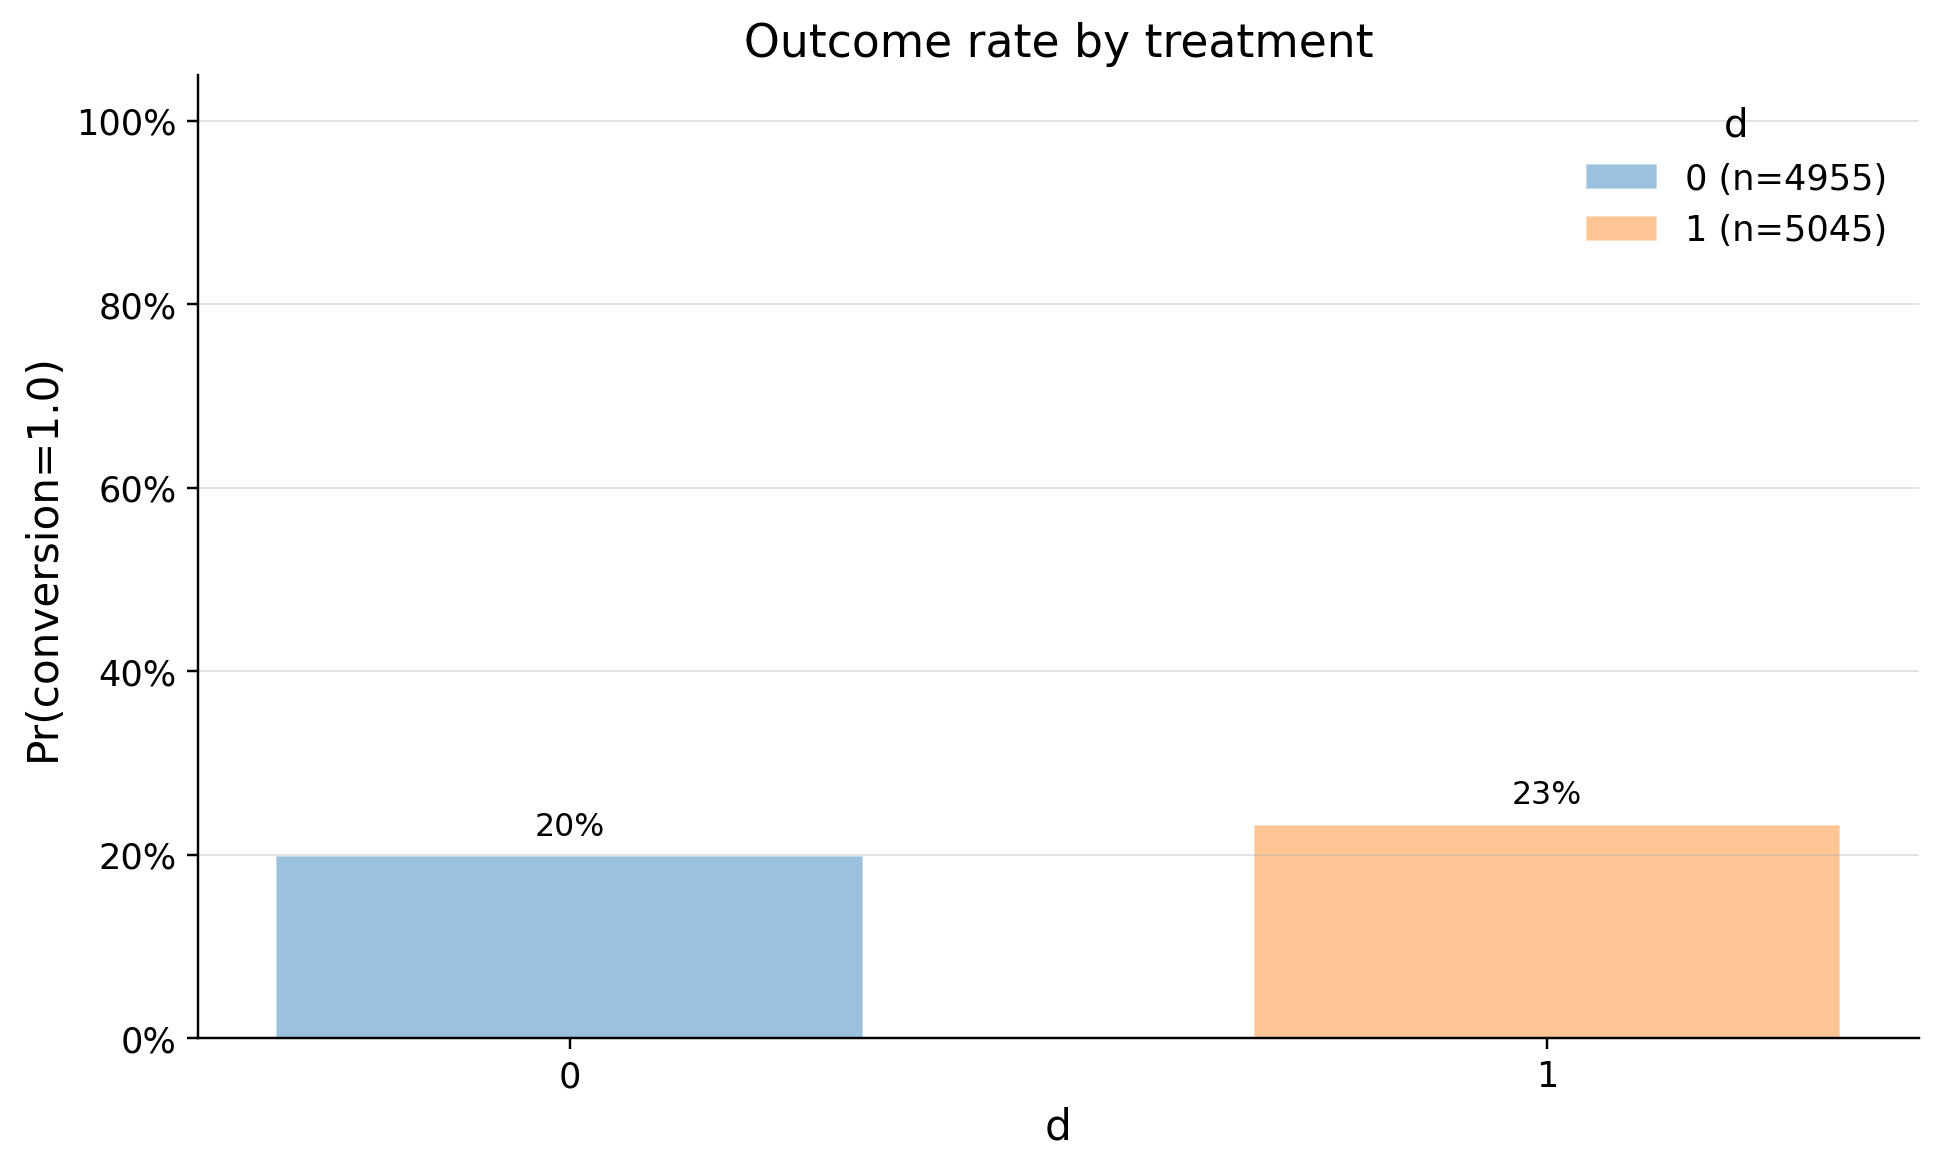
Treatment - new onboarding for new users.
We will test hypothesis:
- There is no difference in conversion rate between treatment and control groups.
- There is a difference in conversion rate between treatment and control groups.
Causal Assumptions
Unconfoundedness: random assignment of treatment. Will be tested with SRM and Balance Check
Overlap: each unit has a non-zero probability of assignment to every arm. By design
SUTVA: no interference and consistent treatment definitions. By design
Data
For the analysis you need data in pandas dataframe:
- treatment column in binary format (1/0)
- outcome column numeric format, measured after treatment time
- user_id column (Optional, but useful)
- confounders columns (Optional, measured before treatment time, numeric format, used for causal assumption check)
We will take data from Causalis DGP. More you can read at https://causalis.causalcraft.com/articles/generate_classic_rct_26
| user_id | conversion | d | platform_ios | country_usa | source_paid | m | m_obs | tau_link | g0 | g1 | cate | |
|---|---|---|---|---|---|---|---|---|---|---|---|---|
| 0 | 01fc4 | 0.0 | 0.0 | 1.0 | 0.0 | 1.0 | 0.5 | 0.5 | 0.106483 | 0.310620 | 0.333868 | 0.023249 |
| 1 | 0204c | 0.0 | 1.0 | 0.0 | 0.0 | 1.0 | 0.5 | 0.5 | 0.106483 | 0.198257 | 0.215727 | 0.017471 |
| 2 | 002cf | 0.0 | 0.0 | 1.0 | 1.0 | 0.0 | 0.5 | 0.5 | 0.106483 | 0.231969 | 0.251479 | 0.019509 |
| 3 | 0202d | 0.0 | 1.0 | 1.0 | 1.0 | 0.0 | 0.5 | 0.5 | 0.106483 | 0.231969 | 0.251479 | 0.019509 |
| 4 | 011cb | 0.0 | 1.0 | 0.0 | 1.0 | 0.0 | 0.5 | 0.5 | 0.106483 | 0.142189 | 0.155678 | 0.013489 |
CausalData(df=(10000, 5), treatment='d', outcome='conversion', confounders=['platform_ios', 'country_usa', 'source_paid'])
EDA
| treatment | count | mean | std | min | p10 | p25 | median | p75 | p90 | max | |
|---|---|---|---|---|---|---|---|---|---|---|---|
| 0 | 0 | 4955 | 0.198991 | 0.399281 | 0.0 | 0.0 | 0.0 | 0.0 | 0.0 | 1.0 | 1.0 |
| 1 | 1 | 5045 | 0.232904 | 0.422723 | 0.0 | 0.0 | 0.0 | 0.0 | 0.0 | 1.0 | 1.0 |
SRM
Our system is randomly splitting users. Half of them must have new onboarding, other half has not. We should monitor the split with SRM test. Read more at https://causalis.causalcraft.com/articles/srm
SRMResult(status=no SRM, p_value=0.36812, chi2=0.8100)
Confounders balance
Are groups equal in terms of confounders? We need to choose with domain and business sense confounders and check balance of them. The standard benchmark:
ks_pvalue< 0.05
| confounders | mean_d_0 | mean_d_1 | abs_diff | smd | ks_pvalue | |
|---|---|---|---|---|---|---|
| 0 | source_paid | 0.299092 | 0.313776 | 0.014684 | 0.031853 | 0.64592 |
| 1 | platform_ios | 0.494046 | 0.502874 | 0.008828 | 0.017654 | 0.98861 |
| 2 | country_usa | 0.586276 | 0.591873 | 0.005597 | 0.011374 | 1.00000 |
As we see system splitted users randomly
SUTVA
1.) Are your clients independent (i). Outcome of ones do not depend on others? 2.) Are all clients have full window to measure metrics? 3.) Do you measure confounders before treatment and outcome after? 4.) Do you have a consistent label of treatment, such as if a person does not receive a treatment, he has a label 0?
Estimation with Diff-in-Means
In Causalis.DiffInMeans model implemented ttest, conversion_ztest and welch_permutation_t_test:
- use
conversion_ztestwhen users < 100k and outcome is binary - use
welch_permutation_t_testwhen users < 10k or outcome is ratio metric or your metric is highly skewed - in other cases use
ttest
Read more in https://causalis.causalcraft.com/articles/rct-classic-model
We will use conversion_ztest for our scenario
| value | |
|---|---|
| field | |
| estimand | ATE |
| model | DiffInMeans |
| value | 0.0339 (ci_abs: 0.0111, 0.0567) |
| value_relative | 17.0425 (ci_rel: 8.2614, 25.8235) |
| alpha | 0.0500 |
| p_value | 0.0000 |
| is_significant | True |
| n_treated | 5045 |
| n_control | 4955 |
| treatment_mean | 0.2329 |
| control_mean | 0.1990 |
| time | 2026-05-09 |
Let's compare ATE with oracle effect
Ground truth ATE is 0.01719144406311028