CUPED Benchmarking DGPs
Three scenarios for testing variance reduction:
- Continuous outcome, moderate correlation ()
- Binary outcome (harder to gain variance reduction)
- Continuous outcome, high correlation ()
1. Normal Outcome, Moderate Correlation (Target )
Scenario 1 (Normal, Mod): Correlation = 0.5010 Analysis for Scenario 1 (Normal, Mod): True Effect: 0.2000 Naive ATE: 0.1880 (SE: 0.009563) CUPED ATE: 0.1923 (SE: 0.008285) Var Reduction: 24.95%
2. Binary Outcome (Target )
Binary outcomes naturally limit the max correlation achievable with a continuous covariate.
Scenario 2 (Binary): Correlation = 0.2286 Analysis for Scenario 2 (Binary): True Effect: 0.0227 Naive ATE: 0.0168 (SE: 0.002289) CUPED ATE: 0.0173 (SE: 0.002228) Var Reduction: 5.32%
3. Normal Outcome, High Correlation (Target )
Scenario 3 (Normal, High): Correlation = 0.7492 Analysis for Scenario 3 (Normal, High): True Effect: 0.2000 Naive ATE: 0.1880 (SE: 0.009563) CUPED ATE: 0.1961 (SE: 0.006326) Var Reduction: 56.24%
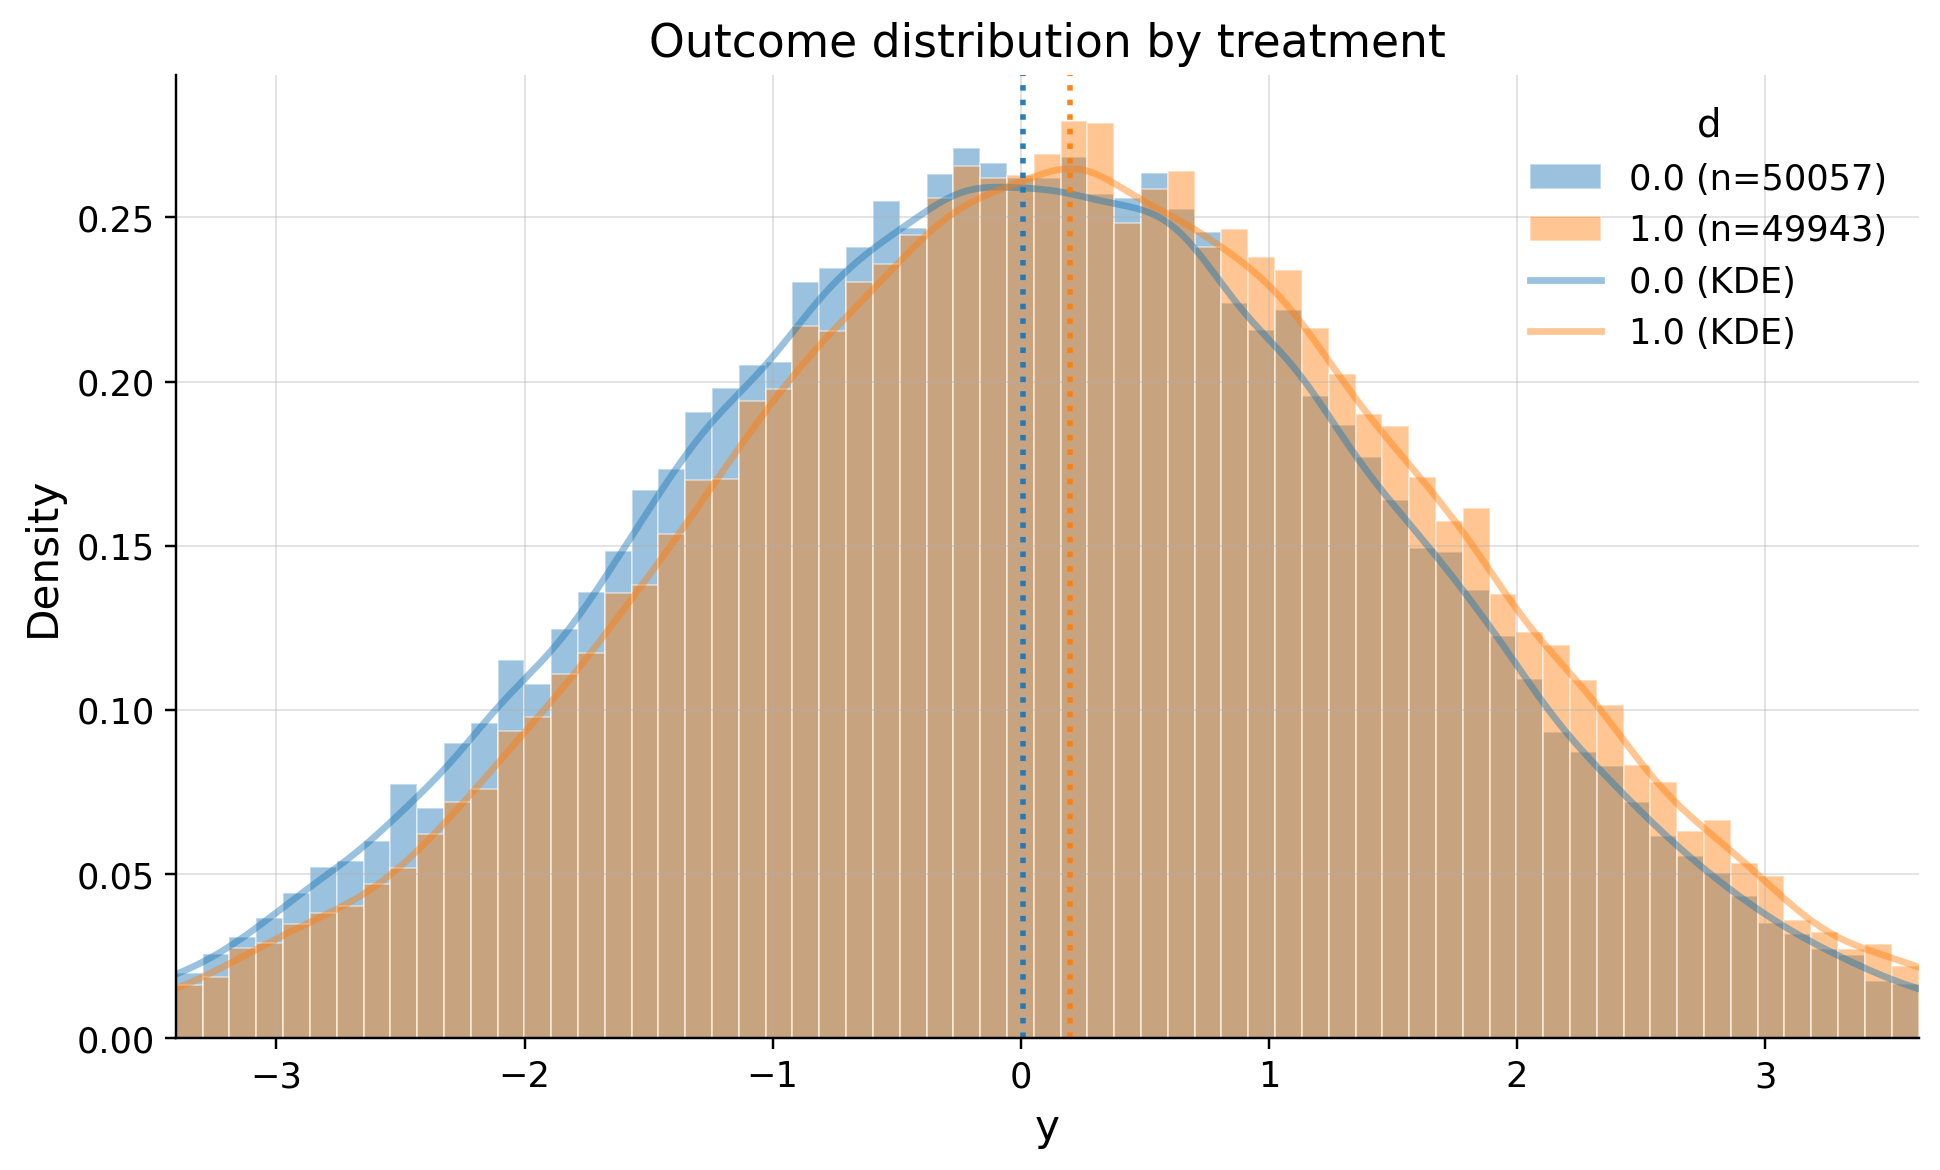
Index(['user_id', 'y', 'd', 'x1', 'x2', 'x3', 'x4', 'x5', 'm', 'm_obs', 'tau_link', 'g0', 'g1', 'cate', 'propensity', 'propensity_obs', 'mu0', 'mu1', 'y_pre', 'age', 'cnt_trans', 'platform_Android', 'platform_iOS', 'invited_friend'], dtype='object')
{'n_rows': 100000, 'n_columns': 8}
| mean_t_0 | mean_t_1 | abs_diff | smd | ks | ks_pvalue | |
|---|---|---|---|---|---|---|
| confounders | ||||||
| age | 35.064806 | 35.140480 | 0.075674 | 0.008984 | 0.006406 | 0.255385 |
| y_pre | 0.004032 | -0.004042 | 0.008074 | -0.007123 | 0.006182 | 0.293687 |
| platform_iOS | 0.594902 | 0.592375 | 0.002527 | -0.005144 | 0.002527 | 0.997139 |
| platform_Android | 0.405098 | 0.407625 | 0.002527 | 0.005144 | 0.002527 | 0.997139 |
| invited_friend | 0.084304 | 0.085077 | 0.000773 | 0.002777 | 0.000773 | 1.000000 |
| cnt_trans | 1.750405 | 1.747532 | 0.002872 | -0.001971 | 0.005151 | 0.519128 |
CupedEffect(ate=0.19611881007038967, se=0.006325868042696929, t_stat=31.002671688165293, p_value=4.948015380616318e-210, ci_low=0.183720186456712, ci_high=0.20851743368406733, alpha=0.05, nobs=100000, cov_type='HC3', use_t=True, adjustment='ancova', ate_naive=0.18802555650105562, se_naive=0.009562868317249035, variance_reduction_pct=56.24135095196503, covariates=['y_pre', 'age', 'cnt_trans', 'platform_Android', 'platform_iOS', 'invited_friend'], beta_covariates=array([ 1.00041861e+00, 3.40287808e-05, 7.90351161e-04, -3.29664881e-03, 3.29664881e-03, 3.59560414e-04]), gamma_interactions=array([], dtype=float64))