Increasing average bill AB test
This notebook presents the classic rct average bill case and the core analysis workflow.
We run a website that sells construction tools. The owner wants to add an option to buy an extended warranty for tools. This is a new paid add-on shown as an extra payment button on the checkout page.
We split users into two groups:
-
Control: users who do not see the new payment button
-
Treatment: users who see the new payment button
We will test hypothesis:
- There is no difference in an average bill between treatment and control groups.
- There is a difference in an average bill between treatment and control groups.
Data
We will use DGP from causalis
| user_id | y | d | platform_ios | country_usa | source_paid | age | cnt_trans | platform_Android | platform_iOS | invited_friend | |
|---|---|---|---|---|---|---|---|---|---|---|---|
| 0 | 00c01 | 62.015001 | 0.0 | 1.0 | 0.0 | 1.0 | 39 | 0 | 0 | 1 | 0 |
| 1 | 014d7 | 22.353186 | 1.0 | 0.0 | 0.0 | 1.0 | 46 | 4 | 0 | 1 | 0 |
| 2 | 01daa | 38.213100 | 0.0 | 1.0 | 1.0 | 0.0 | 36 | 1 | 1 | 0 | 0 |
| 3 | 012b9 | 77.927095 | 1.0 | 1.0 | 1.0 | 0.0 | 26 | 2 | 0 | 1 | 0 |
| 4 | 00e7b | 24.936085 | 1.0 | 0.0 | 1.0 | 0.0 | 35 | 3 | 0 | 1 | 0 |
CausalData(df=(10000, 6), treatment='d', outcome='y', confounders=['platform_ios', 'country_usa', 'source_paid'], user_id='user_id')
| treatment | count | mean | std | min | p10 | p25 | median | p75 | p90 | max | |
|---|---|---|---|---|---|---|---|---|---|---|---|
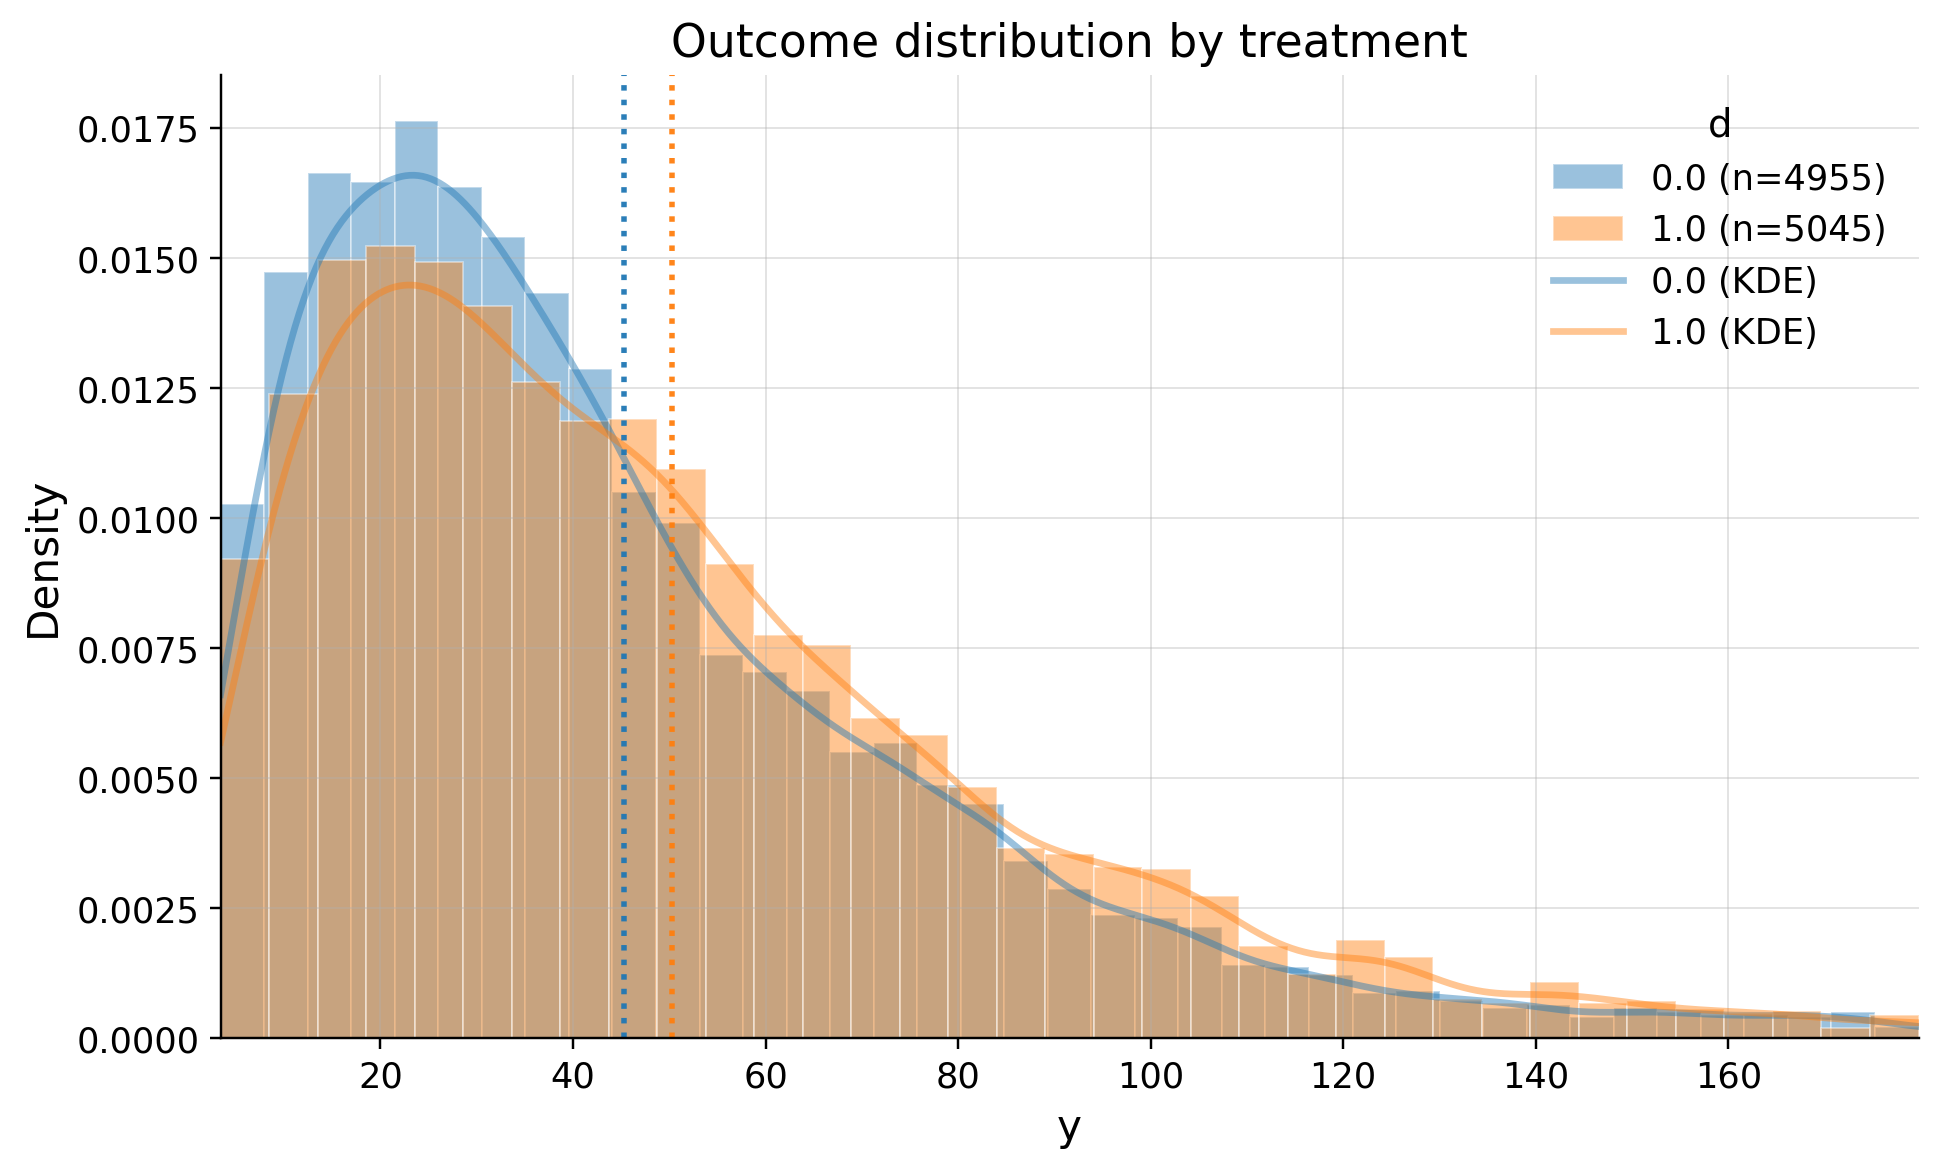
| 0 | 0.0 | 4955 | 45.271228 | 36.185063 | 0.338380 | 11.081530 | 20.326602 | 35.784254 | 60.063958 | 89.576241 | 431.357219 |
| 1 | 1.0 | 5045 | 50.328883 | 38.802710 | 0.448255 | 12.335521 | 22.792900 | 41.149396 | 67.409299 | 100.121519 | 401.883422 |
| treatment | n | outlier_count | outlier_rate | lower_bound | upper_bound | has_outliers | method | tail | |
|---|---|---|---|---|---|---|---|---|---|
| 0 | 0.0 | 4955 | 206 | 0.041574 | -39.279431 | 119.669992 | True | iqr | both |
| 1 | 1.0 | 5045 | 193 | 0.038256 | -44.131698 | 134.333897 | True | iqr | both |
Monitoring
Our system is randomly splitting users. Half of them must have new onboarding, other half has not. We should monitor the split with SRM test. Read more at https://causalis.causalcraft.com/articles/srm
SRMResult(status=no SRM, p_value=0.36812, chi2=0.8100)
Check the confounders balance
Are groups equal in terms of confounders? We need to choose with domain and business sense confounders and check balance of them. The standard benchmark:
ks_pvalue< 0.05
| confounders | mean_d_0 | mean_d_1 | abs_diff | smd | ks_pvalue | |
|---|---|---|---|---|---|---|
| 0 | source_paid | 0.299092 | 0.313776 | 0.014684 | 0.031853 | 0.64592 |
| 1 | platform_ios | 0.494046 | 0.502874 | 0.008828 | 0.017654 | 0.98861 |
| 2 | country_usa | 0.586276 | 0.591873 | 0.005597 | 0.011374 | 1.00000 |
As we see system splitted users randomly
Estimation with Diff-in-Means
| value | |
|---|---|
| field | |
| estimand | ATE |
| model | DiffInMeans |
| value | 5.0577 (ci_abs: 3.6104, 6.5552) |
| value_relative | 11.1719 (ci_rel: 7.7490, 14.5948) |
| alpha | 0.0500 |
| p_value | 0.0000 |
| is_significant | True |
| n_treated | 5045 |
| n_control | 4955 |
| treatment_mean | 50.3289 |
| control_mean | 45.2712 |
| time | 2026-02-12 |
Executive summary
We observed a statistically significant increase in average order value from 45.2 to 50.3 dollars (+ 5.06). The 95% confidence interval for the absolute lift is [3.59, 6.51].
The decision is whether to roll out this change (scale it to all users).